Stroke quantification where there is no perfusion scanner
NCCT NWU Insightz reads a routine non-contrast head CT and returns Net Water Uptake (NWU), a deep-learning infarct core, and an automated CT-ASPECTS score — bringing quantitative measurement to centres that have no CTP or MRI, for interpretation by qualified healthcare professionals.
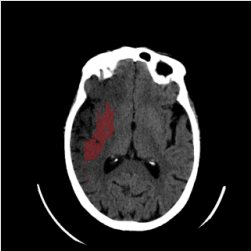
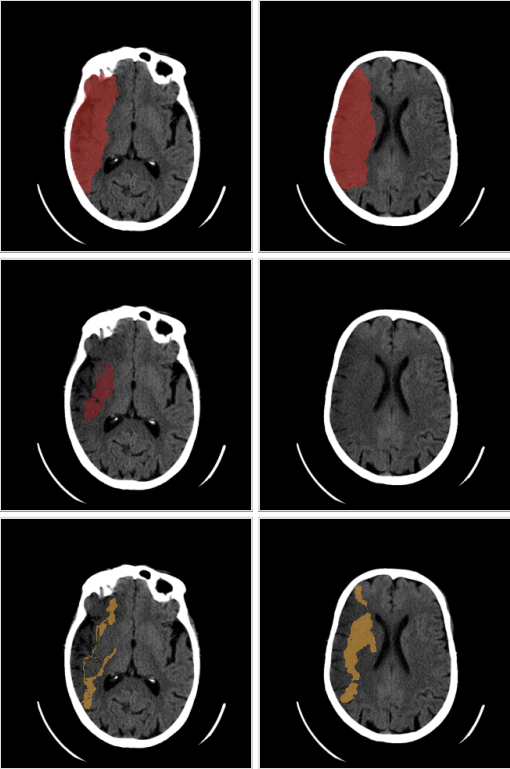
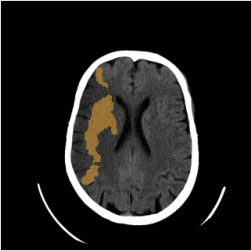
What it measures
NWU is the percentage density loss of ischemic tissue against the mirrored healthy hemisphere — a direct imaging proxy for the water that accumulates in infarcted brain. The pipeline computes it voxel-wise, then reports it three ways: total core volume, an elevated band, and a mean within the DL-detected lesion.
Processing Pipeline
Fully automated from DICOM ingest to clinical report.
Pipeline
- 1Routine non-contrast head CT (DICOM) ingestion
- 2Density comparison against the mirrored healthy hemisphere
- 3Voxel-wise Net Water Uptake (NWU) computation
- 4Deep-learning lesion segmentation
- 5Automated CT-ASPECTS across all 10 regions
- 63-page structured report generation
Outputs
- Voxel-wise NWU
- DL infarct core (mL, left/right)
- NWU > 11.5% volume (mL, left/right)
- Elevated NWU band
- CT-ASPECTS 0–10 with per-region table
- Segmentation overlays on axial slices and in the viewer
Measurements
Net Water Uptake (NWU)
Percentage density loss against the mirrored healthy hemisphere, computed voxel-wise
DL Infarct Core
Deep-learning core volume in mL, left and right
NWU > 11.5% Volume
Core volume by NWU threshold in mL, left and right
Core Concordance
Agreement between the two independent core estimates
Mean Lesion NWU
Mean NWU within the DL-detected lesion
CT-ASPECTS
0–10, with involved/normal status for each of the 10 regions
What the report gives the clinician (3 pages)
- CT-ASPECTS 0–10 with a per-region involved/normal table across all 10 regions
- Two independent core estimates — DL infarct core (mL, left/right) and NWU > 11.5% (mL, left/right) — plus their concordance, so disagreement is visible rather than hidden
- Elevated NWU band with lateralised excess and a stated detection limit
- Edema progression rate (%/h) when onset or last-known-well time is supplied — and onset can be entered after processing, re-rendering the report without re-running the scan
- Literature-referenced flags for large core volume, hemispheric involvement, insula involvement and a published malignant-edema criterion, each carrying its citation
- Segmentation overlays on axial slices, and the same overlays in the viewer
AI-Generated Visualizations
A preview of the parameter maps and overlays generated by NCCT NWU Insightz. For the complete clinical report, .
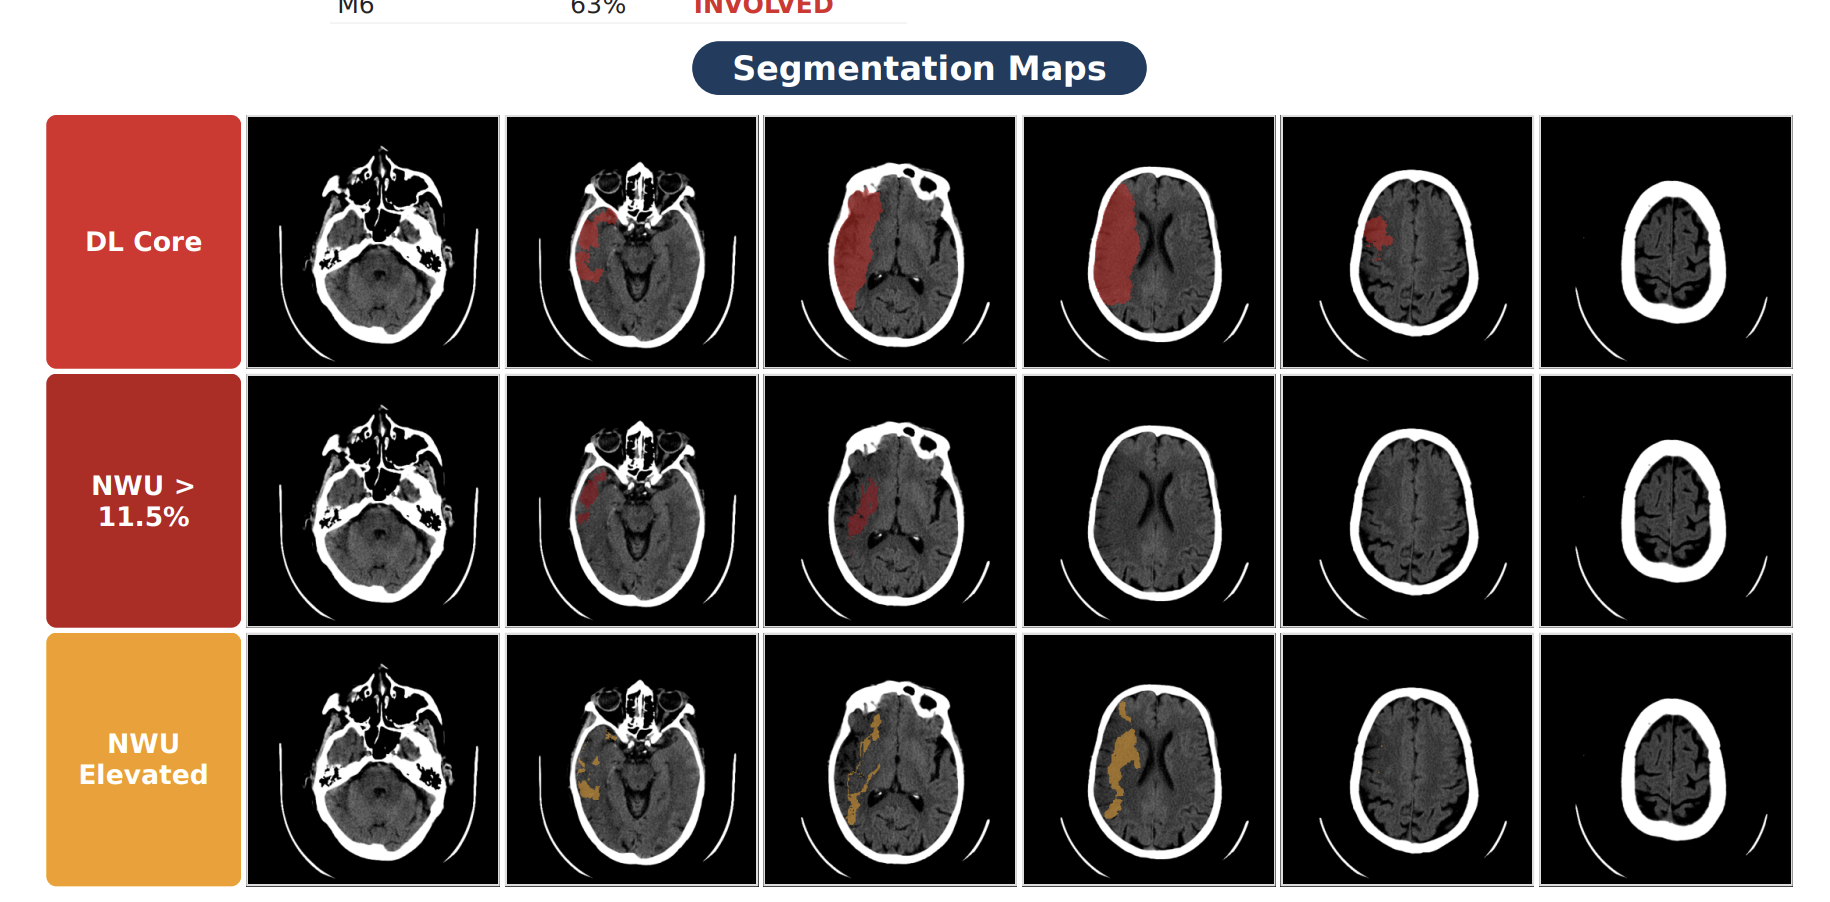
Segmentation maps on axial slices — DL core (top), NWU > 11.5% (middle) and elevated NWU band (bottom)
Ready to experience NCCT NWU Insightz?
Schedule a personalized demo to see how our AI-powered perfusion analysis transforms your clinical workflow.